
Real Hotel Performance
Results measured in revenue,not vanity metrics. แต่ไม่สร้างผล
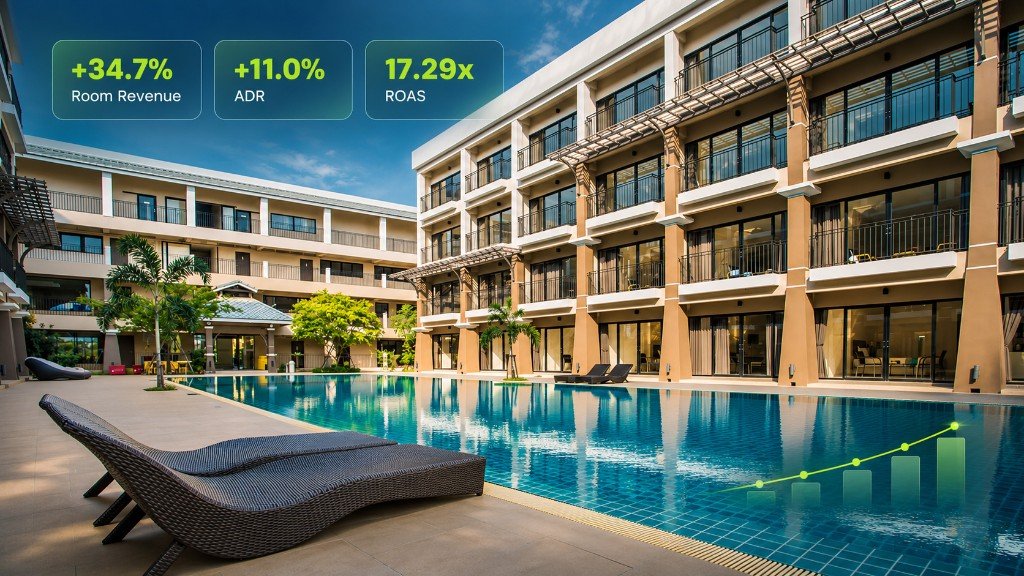
From pricing and distribution to direct-booking campaigns, we focus on measurable commercial results — Room Revenue, ADR, Occupancy, RevPAR and ROAS.
Selected Hotels & Properties
Selected hotels and properties we've worked with






























Results Overview
Before–After Room Revenue
First six months from October 2025 · Baseline (before) = ฿16.03M
Room RevenueBaseline (before) · ฿16.03M
Growth came primarily from selling more room nights at stronger occupancy, rather than simply increasing rates.
Additional Revenue
+฿5.57MFirst six months from October 2025฿16.03M → ฿21.60MAnonymised case dataROAS
17.29×June 2026฿62K ad spend → ฿1.07M booking revenueAnonymised case dataADR
+11.0%Annual฿1,880 → ฿2,087Anonymised case dataResults depend on the period, season, pricing, channel and the data available from the hotel.
Case Studies
Measurable commercial results
SAMPLE VISUALCase visual placeholder · Replace with approved assetReplace with approved assetRecommended: 1200 × 800 px
Revenue & Distribution Management: Hotel property photo or Revenue Report
+34.7% Room Revenue in the First Six Months
Premium pool villa property, Layan
First six months from October 2025
+34.7% Room Revenue
Challenge
The property came under revenue and distribution management just before Phuket’s high season.
The commercial opportunity was to improve room-night production, occupancy and overall room revenue through stronger pricing, inventory and distribution decisions.
Analysis
Growth came primarily from selling more room nights at stronger occupancy, rather than simply increasing rates.
Action
- Revenue and pricing optimisation
- Dynamic rate and inventory control
- OTA and distribution optimisation
- Demand and booking-pace monitoring
- Yield management for peak dates
- Tactical actions for need dates
- Regular pickup analysis
- Continuous market adjustments
Result
+34.7% Room Revenue
First six months from October 2025
฿16.03M → ฿21.60M
Anonymised case data
Better revenue management is not only about raising prices. It is about matching pricing, inventory and demand at the right time.
Results depend on the period, season, pricing, channel and the data available from the hotel.
SAMPLE VISUALCase visual placeholder · Replace with approved assetReplace with approved assetRecommended: 1200 × 800 px
Digital Performance: Campaign report or ROAS chart
17.29× ROAS After Rebuilding Tracking & Search Strategy
Boutique hotel and residence, Patong
June 2026
17.29× ROAS
Challenge
The property needed stronger performance measurement and better visibility across branded, high-intent hotel searches.
Action
- Rebuilt attribution through Google Tag Manager
- Reworked campaign structure
- Strengthened branded search placement
- Improved conversion measurement
- Connected campaign activity to booking revenue
Result
17.29× ROAS
June 2026
฿62K ad spend → ฿1.07M booking revenue
Anonymised case data
Better tracking and campaign structure made it possible to measure and improve performance against actual booking revenue.
Results depend on the period, season, pricing, channel and the data available from the hotel.
SAMPLE VISUALCase visual placeholder · Replace with approved assetReplace with approved assetRecommended: 1200 × 800 px
Digital Performance: Campaign report or ROAS chart
14.89× ROAS from Direct Booking Campaigns
5-star resort, Coconut Island
July 2026
14.89× ROAS
Challenge
The objective was to turn a controlled paid-search budget into measurable direct booking revenue rather than focusing only on impressions, clicks or traffic.
Action
- Used five years of CRM data
- Built a tightly structured Google Search campaign
- Focused targeting around high booking intent
- Measured campaign performance against booking revenue
- Prioritised direct-booking conversion over traffic volume
Result
14.89× ROAS
July 2026
฿60K ad spend → ฿1.80M booking revenue
Anonymised case data
A modest advertising budget can generate strong direct revenue when historical customer data, campaign structure and booking intent are aligned.
Results depend on the period, season, pricing, channel and the data available from the hotel.
SAMPLE VISUALCase visual placeholder · Replace with approved assetReplace with approved assetRecommended: 1200 × 800 px
Revenue & Distribution Management: Hotel property photo or Revenue Report
Already Busy. Now More Profitable.
Independent boutique hotel, Patong
Annual
+12.8% Room Revenue
Challenge
The hotel was already operating above 80% occupancy.
The challenge was therefore not simply to sell more rooms, but to increase the value generated from every room already being sold.
Analysis
Most of the revenue improvement came from stronger ADR rather than significantly increasing room volume.
Action
- Dynamic pricing
- Daily rate optimisation
- Inventory optimisation
- OTA management
- Pickup monitoring
- High-demand date strategy
- Tactical pricing for softer periods
Result
+12.8% Room Revenue
Annual
฿14.40M → ฿16.25M
Anonymised case data
Same hotel. Same rooms. Each room sold more effectively.
Results depend on the period, season, pricing, channel and the data available from the hotel.
Results shown are based on individual hotel performance during the stated periods. Results vary depending on property, market conditions, product, pricing, distribution and operational factors and do not guarantee future performance.
Hotel Performance Review
Where Could Your Hotel Be Leaving Revenue on the Table?
We review your pricing, distribution, booking pace and commercial performance to identify where additional revenue opportunities may exist.
- Review where revenue may be leaking
- See opportunities from Pricing and Distribution
- Receive an Action plan you can take forward
SAMPLE VISUALตัวอย่าง Case Study ReportReplace with approved assetRecommended: 1200 × 800 px
Связанные страницы и материалы
Внутренние ссылки на решения, статьи, инструменты и другие страницы.